An Infographic About Creating Effective Infographics
A very famous saying, “a picture is worth a thousand words”, is absolutely true, especially in the case of infographics. Infographics are on the tip of everyone’s tongue these days – there are even entire websites dedicated to them. Due to their immense attracting capacity and viral nature, they have gained so much popularity and earned matchless reputation in the internet world. As compared to ordinary text articles, infographics get more social media shares and drive more traffic to your website. Here are some interesting facts about infographics that you might not know about:
- Every day, the infographic production increases by 1%.
- Infographics are 30 times more likely to be read than normal blog posts.
- They can enhance your business by 82% by raising brand awareness.
- An infographic has the potential to reach 26 million people.
- High quality infographics are 40 times more likely to be shared than text articles on social media networks.
People love infographics, and the statistics prove it: In the last five years, Google searches for the term “infographics” have increased by 25X. On an average, uploading an infographic can increase your website traffic by 12%.
To help you make your infographic stand out of the crowd, we’ve created this infographic that will show you 10 best practices for creating killer infographics. Whether you’re a professional designer or digital marketer, just implement these 10 things and make your infographic go viral quickly.
Take a look at our infographic for more information!
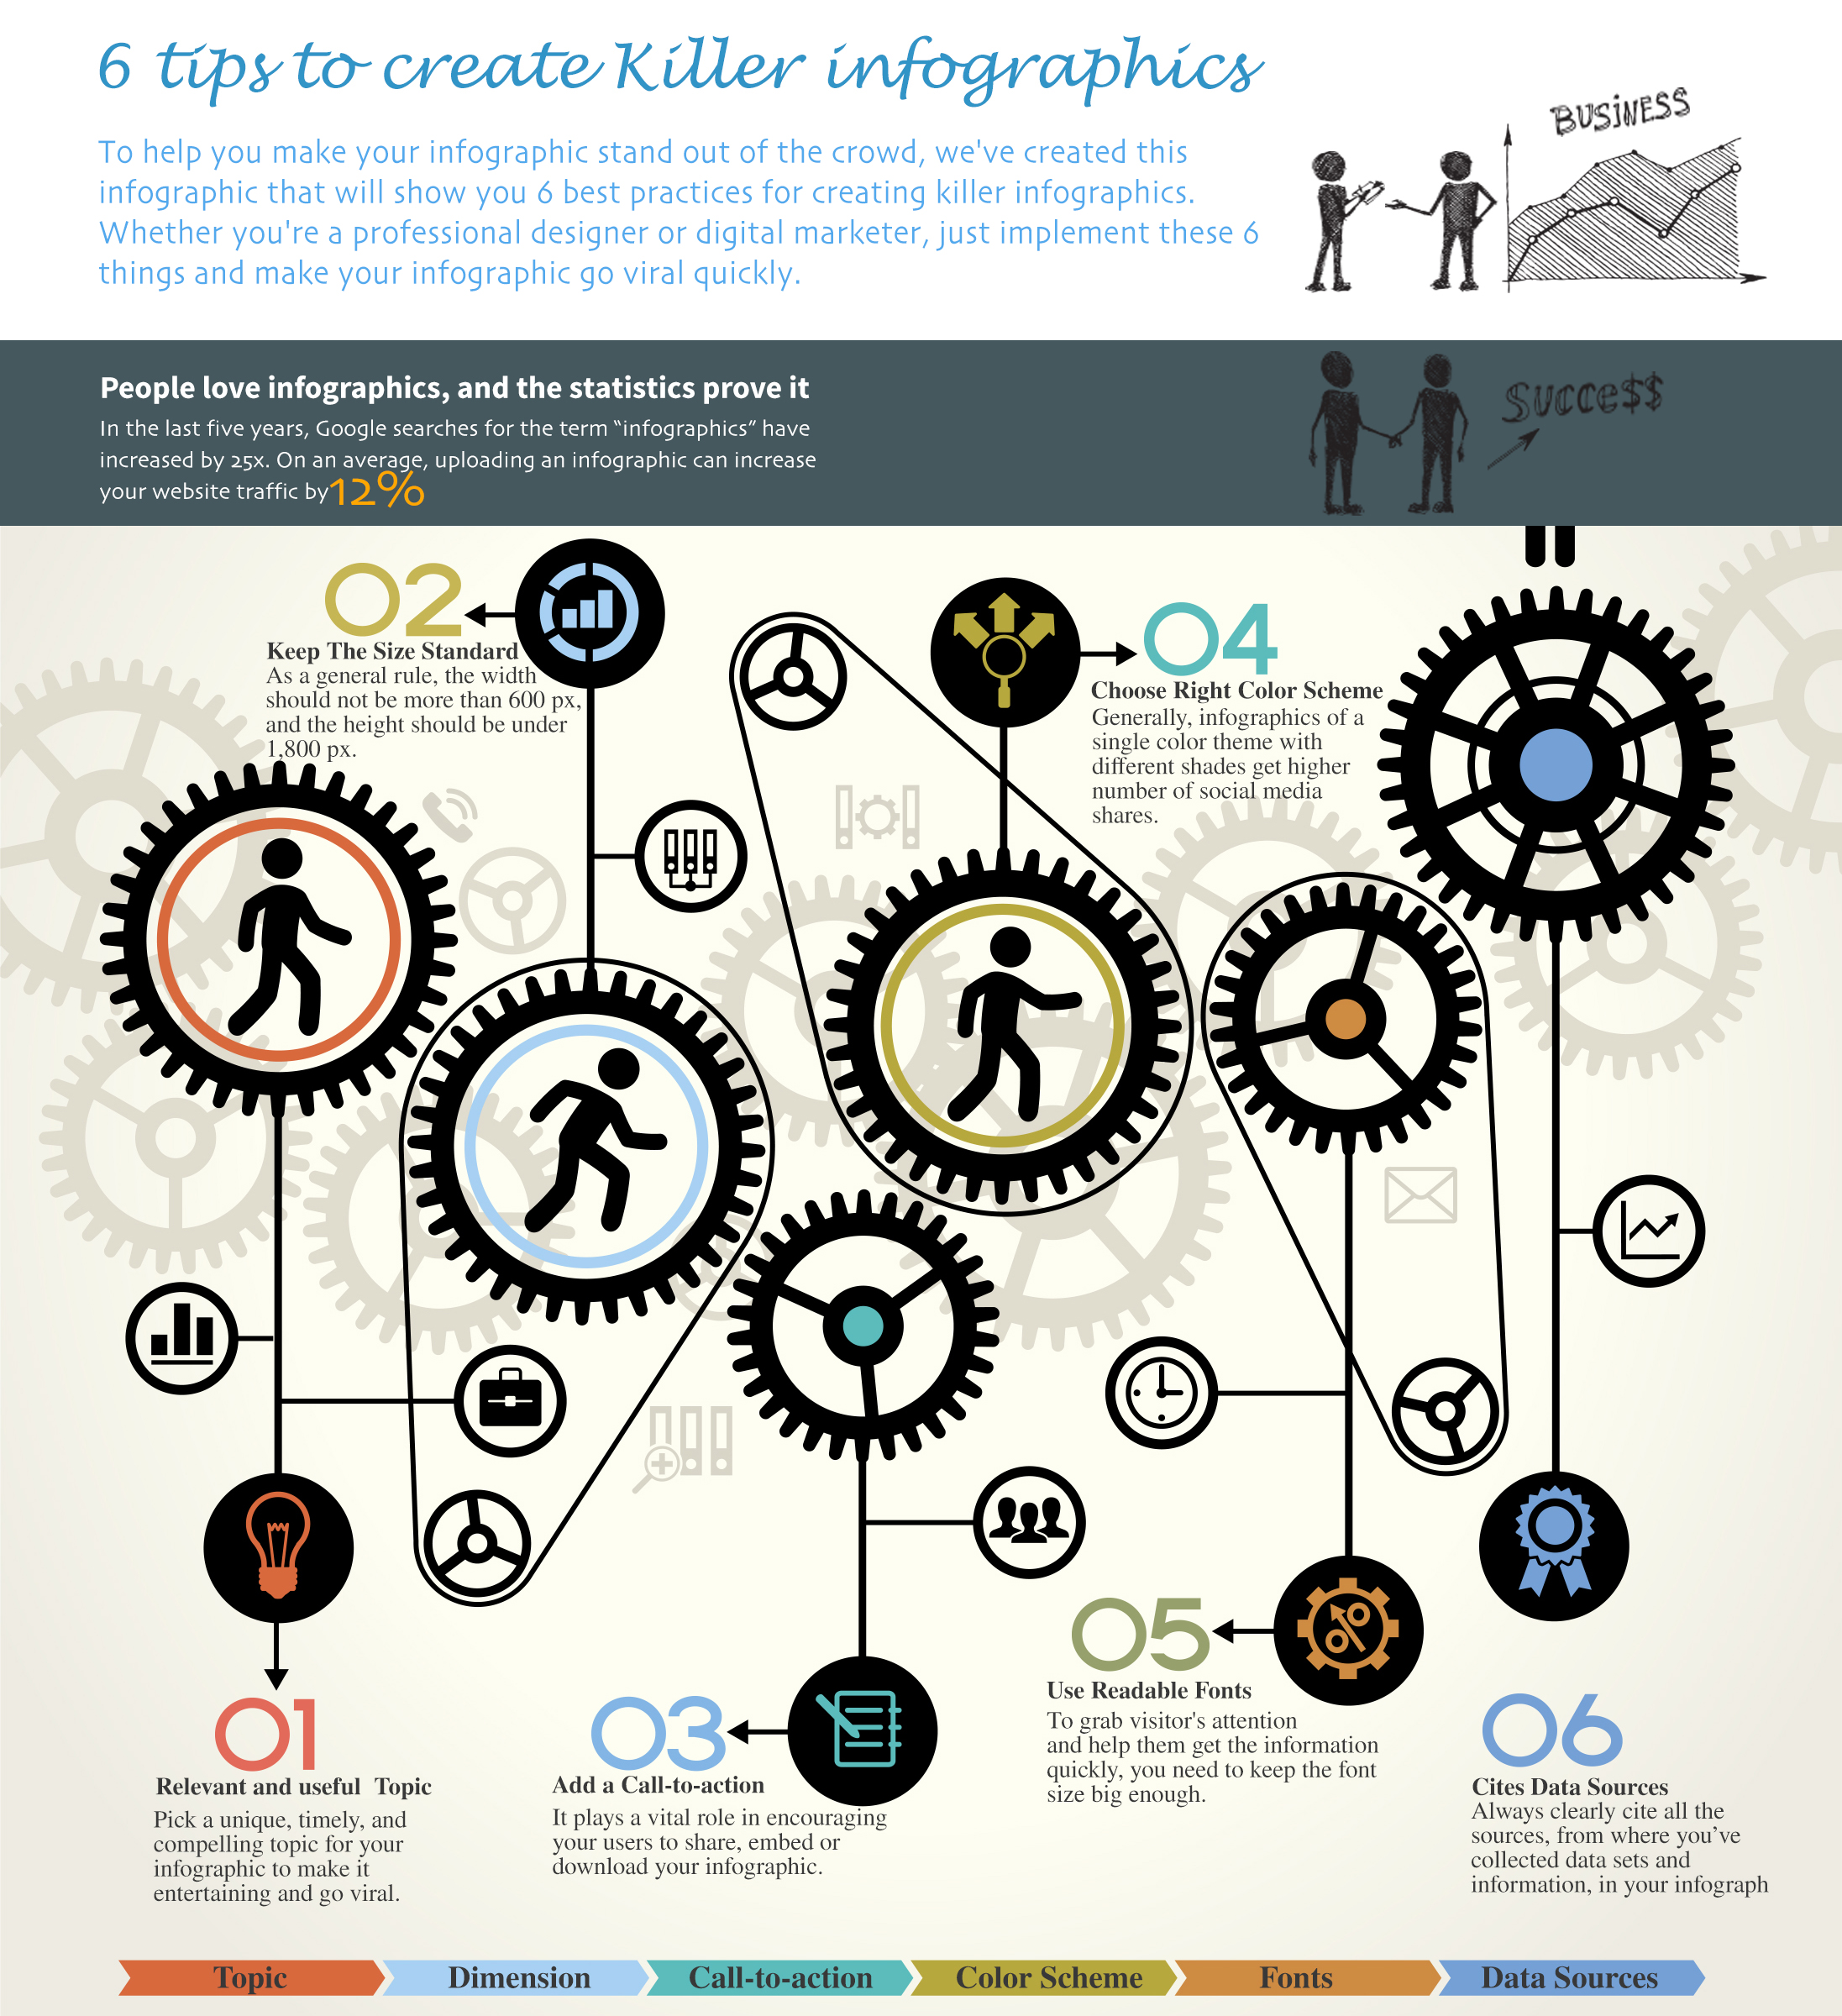
6 Tips for Designing Killer Infographics
Pick an Interesting Topic:
One of the most important elements of a successful infographic is Topic. It doesn’t matter how much beautiful the design of your infographic is. If the topic is boring, then your infographic will fail. So you need to pick a unique, timely, and compelling topic for your infographic to make it entertaining and go viral.
Keep The Size Standard:
What should be the perfect size of an infographic? This question will surely come in every infographic designer’s mind. Well, there’s no ideal size, but as a general rule, the width of an infographic should not be more than 600 pixels, and the height should be under 1,800 pixels for a better user experience.
Add a Call-to-action:
This is another crucial element that most of the designers often forget to include in their infographic. A call-to-action plays a vital role in encouraging your users to share, embed or download your infographic. So, we highly recommend you to add a clear call to action in the footer of your infographic.
Select the Right Color Scheme:
Use a right color combination to get the most out of your infographic. Generally, infographics of a single color theme with different shades get higher number of social media shares than infographics with random colors in each section, but it’s suggested to use the color combination according to your topic.
Use Readable Fonts:
To get your readers fall in love with your infographic at first sight, instantly grab their attention and help them get the information quickly, you need to keep the font size big enough. Also, avoid using too many fonts, as this may make your infographic ugly.
Cite Data Sources:
Always clearly cite all the sources, from where you’ve collected data sets and information, in your infographic. If you don’t, you may be a victim of copyright infringement. Make sure the data sources you’re mentioning are authentic, as forged sources may result in less social media sharing.